High-Sodium Foods Chart
Filter a chart of high sodium foods by category and serving size. See sodium per serving and its percentage of the 2,300 mg daily limit.
Result
Choose a category, threshold and serving size.
iPhone & iPad · Free
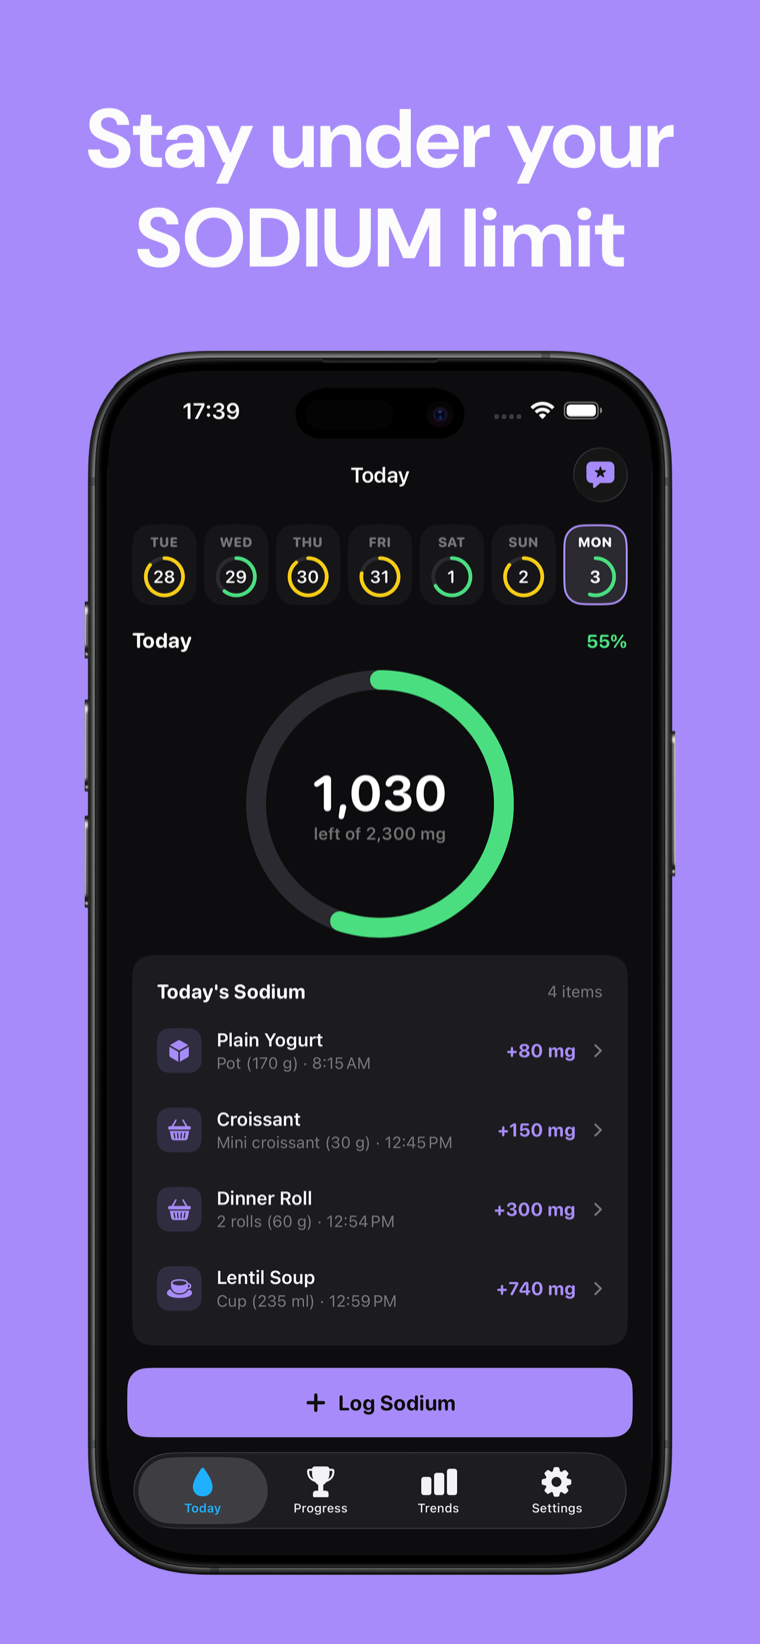
Track it in Sodium Tracker.
Keep food notes and nutrition references organized privately on your device.

How this high sodium foods chart works
This high sodium foods chart starts with a static table of foods and their sodium values per 100 g. Choose a category, set a minimum sodium threshold and enter the serving size you want to compare.
The chart converts each per-100-g value to your selected serving size, filters out foods below your threshold and sorts the remaining foods from highest to lowest sodium per serving. The percentage uses the published 2,300 mg sodium daily limit.
A single food value is a reference point, not a diagnosis or personal nutrition prescription. A clinician or registered dietitian can help interpret dietary needs for your situation.
sodium per serving = sodium per 100 g × serving grams ÷ 100; daily limit % = sodium per serving ÷ 2,300 mg × 100 Food composition values are rounded as reported by USDA FoodData Central. Daily reference values can differ by person and guidance; the tool displays the 2,300 mg/day reference supplied by its source.
USDA FoodData Central ↗NIH Office of Dietary Supplements ↗FDA: Sodium in your diet ↗
High sodium foods chart FAQ
What does the threshold filter do?
It keeps foods whose calculated sodium per selected serving is at or above the number you enter.
Why can my serving size differ from a label serving?
This tool lets you compare a consistent gram amount across foods. Food labels may use their own serving definitions, so compare the chart with the label for the product you have.
What daily limit does the percentage use?
The chart uses 2,300 mg per day, the sodium limit provided in the factual source. It is a reference figure, not individualized advice.
Are values shown for table salt realistic for a meal?
The table uses the supplied per-100-g value and your selected serving size as a mathematical reference. A teaspoon of table salt is 6 g in the source, so choose a serving size that matches what you are comparing.
Does this chart diagnose or treat a health condition?
No. It is an educational reference and cannot diagnose a condition or recommend a diet. Ask a qualified clinician or dietitian about personal nutrition guidance.